
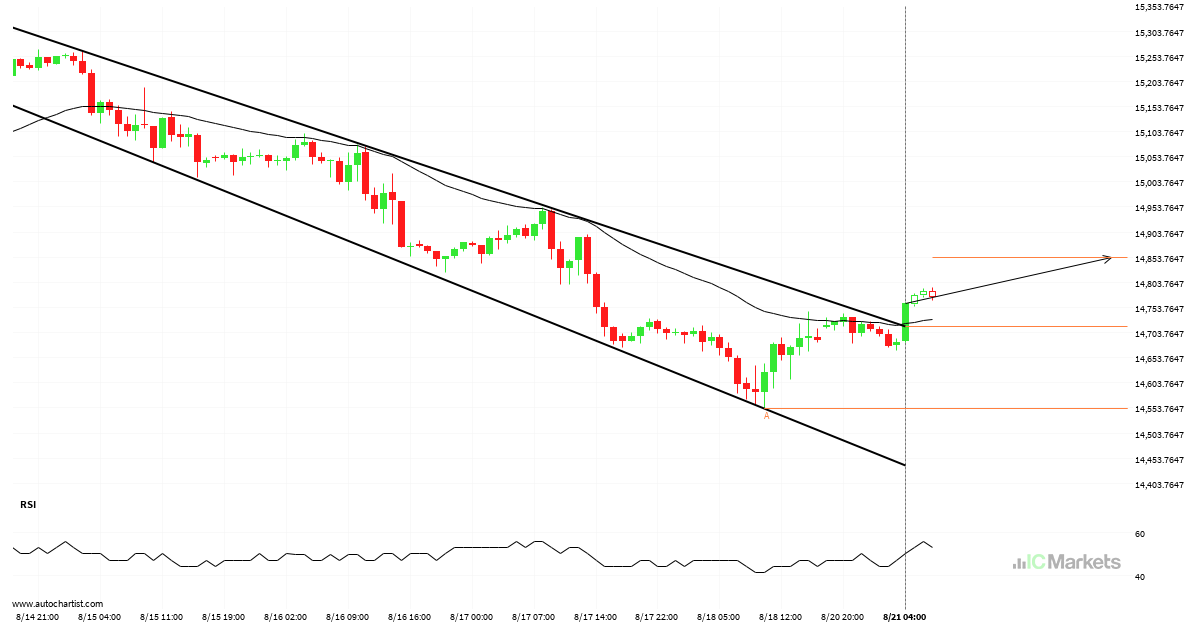
A possible start of a bullish trend on US Tech 100 Index
US Tech 100 Index has broken through a resistance line of a Canal descendente chart pattern. If this breakout holds true, we may see the price of US Tech 100 Index testing 14852.6569 within the next 2 days. But don’t be so quick to trade, it has tested this line in the past, so you should confirm the breakout before taking any action.
Open Trading Account Try a Free Demo